
Soft Open #001
Learning in the Open

Hello!
Hi, and welcome to my newsletter. I’m very grateful to you for signing up. I have ideas about what to do with this newsletter, but I’m also inviting you to reply, make comments etc. It will all help shape things!
There will be other posts about different topics in the future, but if any of it isn’t your thing, then I get it. But if you know of anyone that might like it, then please share!
Focus
Newsletter
The focus of this newsletter is learning. I’m going to teach myself things and write about what I’ve learned.
This has multiple benefits:
Structures my thinking
Teaches others
Can be used immediately as a portfolio piece
Invites input from others so – mistakes can be spotted faster
Software Engineering
My current area of focus for learning is Software Engineering. It’s something that is both hard and that I am bad at. I have a specific case that I want to solve, and therefore teach myself software engineering along the way.
During this project I will use Stockdale style thinking. Victor Frankl would call this “tragic optimism”. It means having both an unflinching realistic view of a situation combined with an unwavering will to persevere. More on this here.
How can I easily make multiple pages of static graphs?
As far as I know there is no existing solution to this problem. There are many solutions to “Dynamic Data on a Website” i.e. Dashboards; e.g. Tableau, Power BI, etc. These are are all very good but that solution space is crowded.
My proposed solution can be summed up:
Scratch for data visualisation
Conception
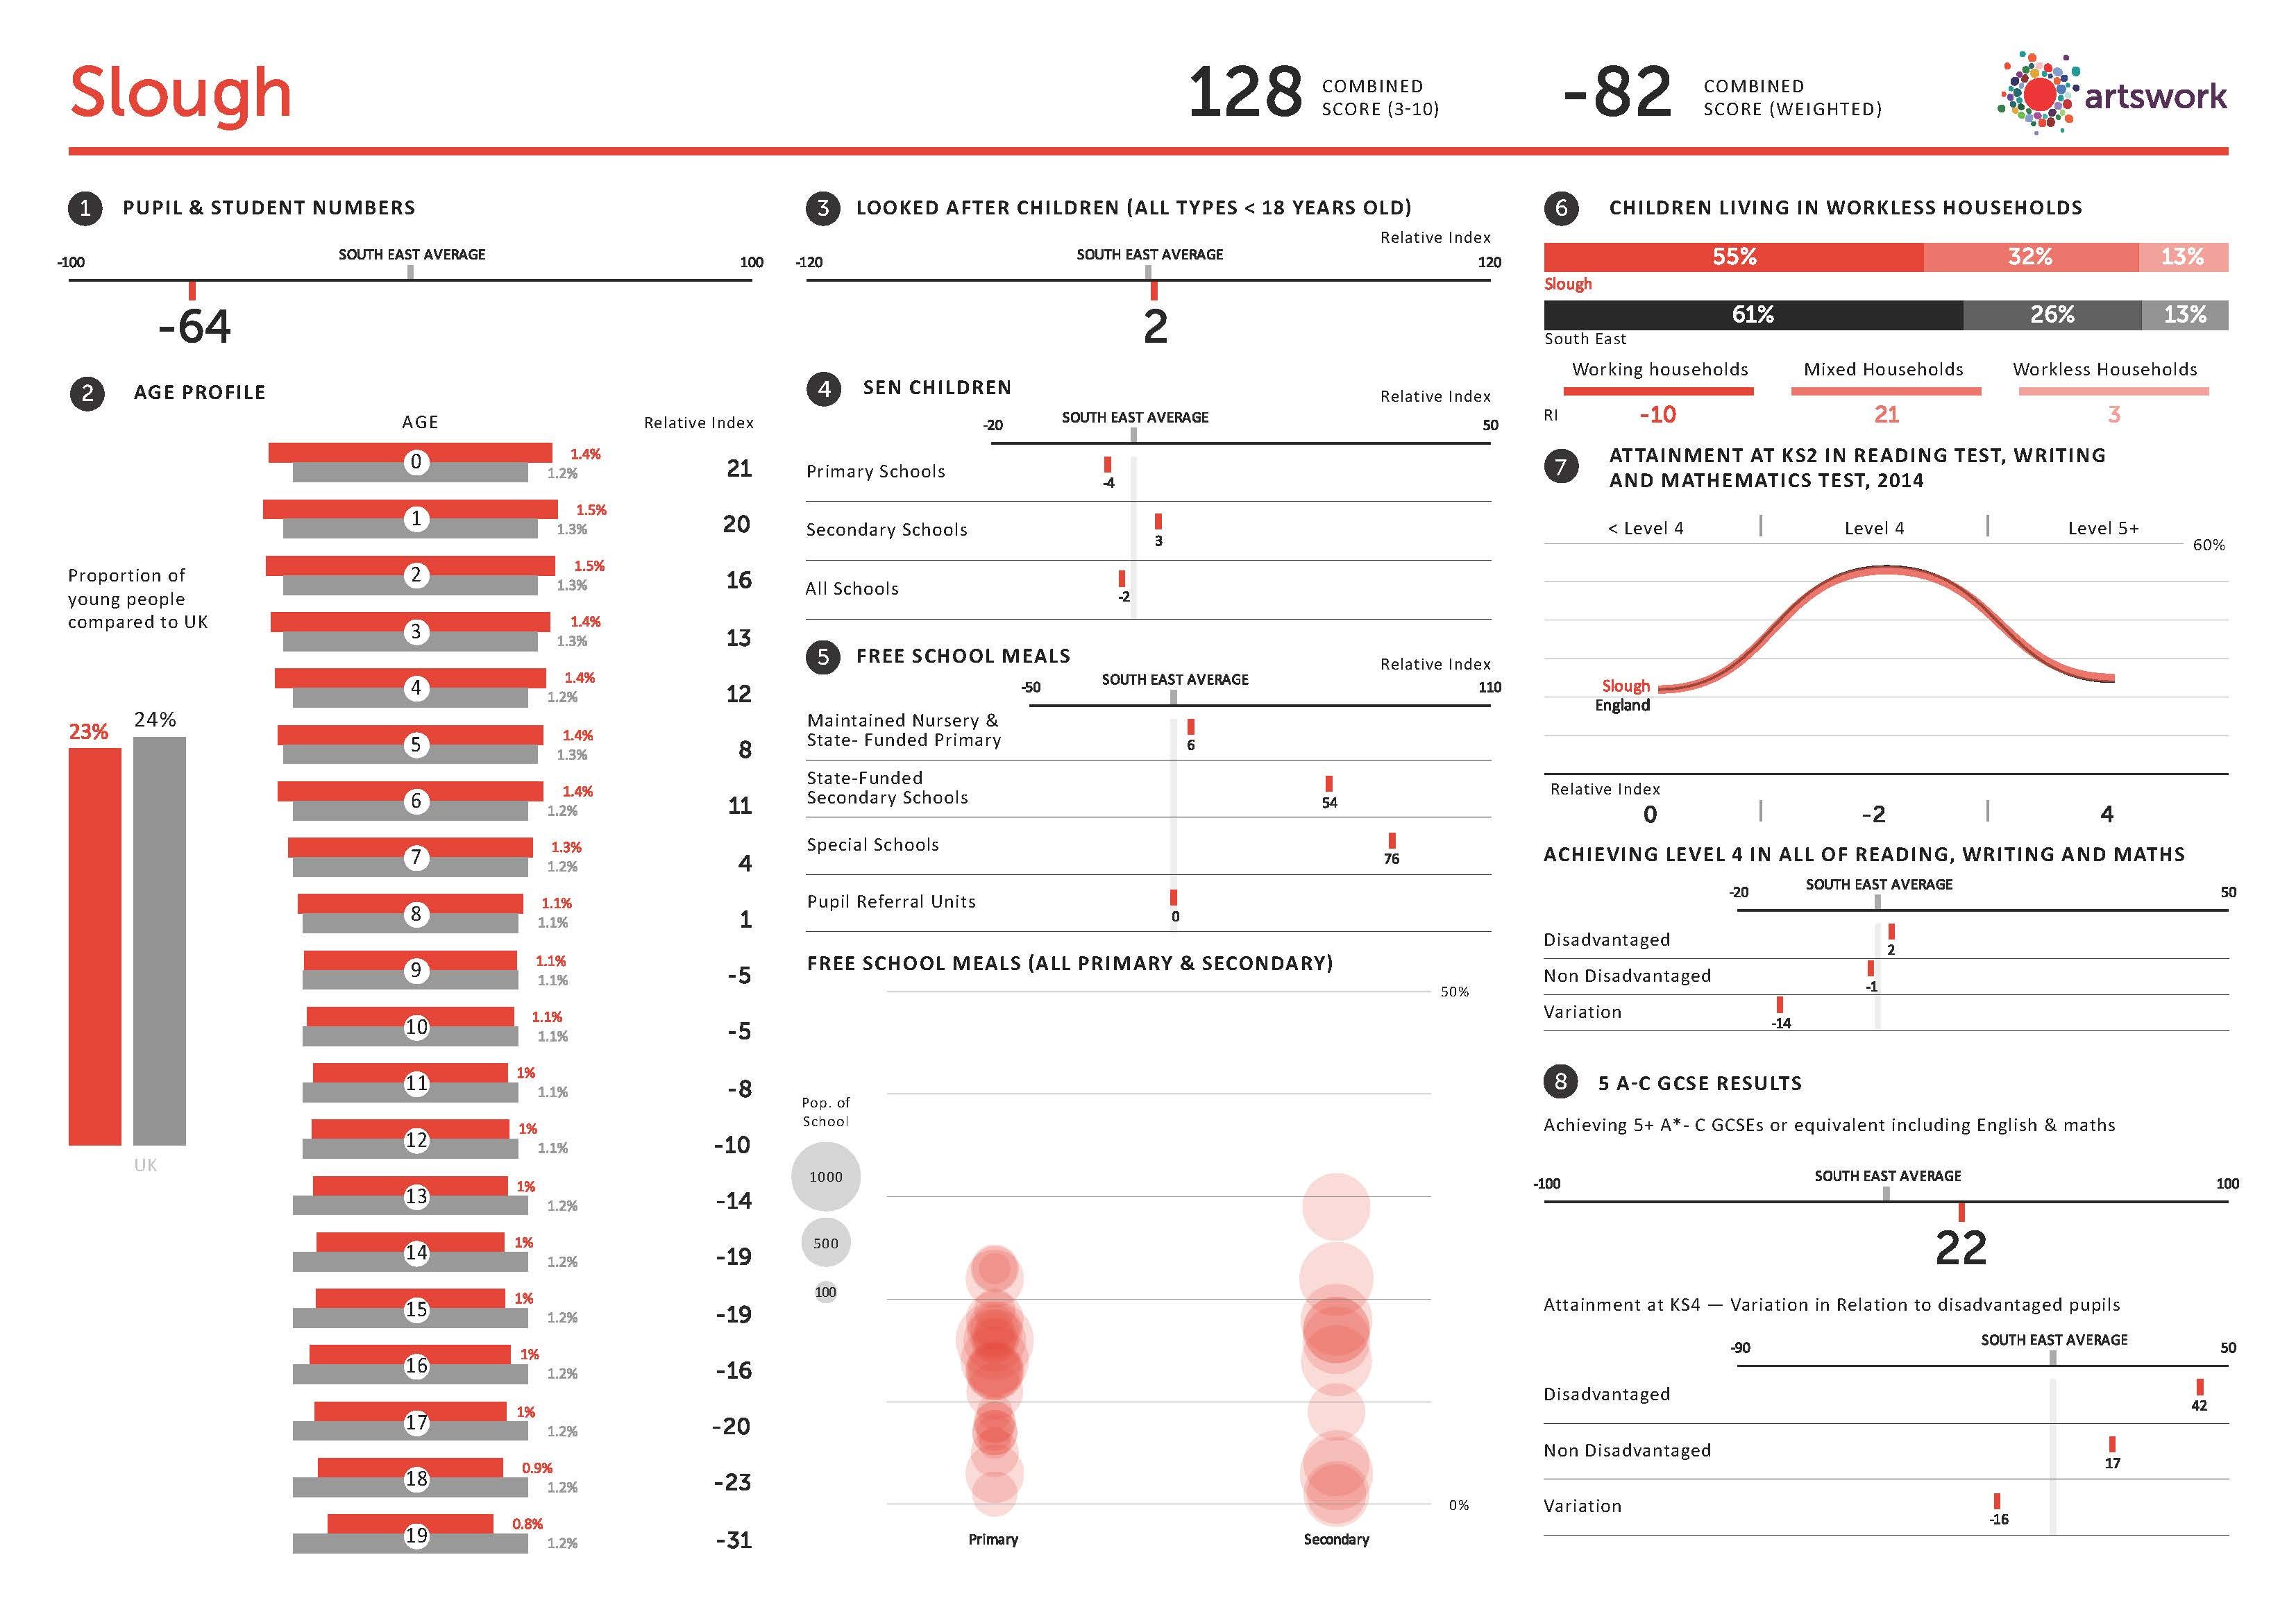
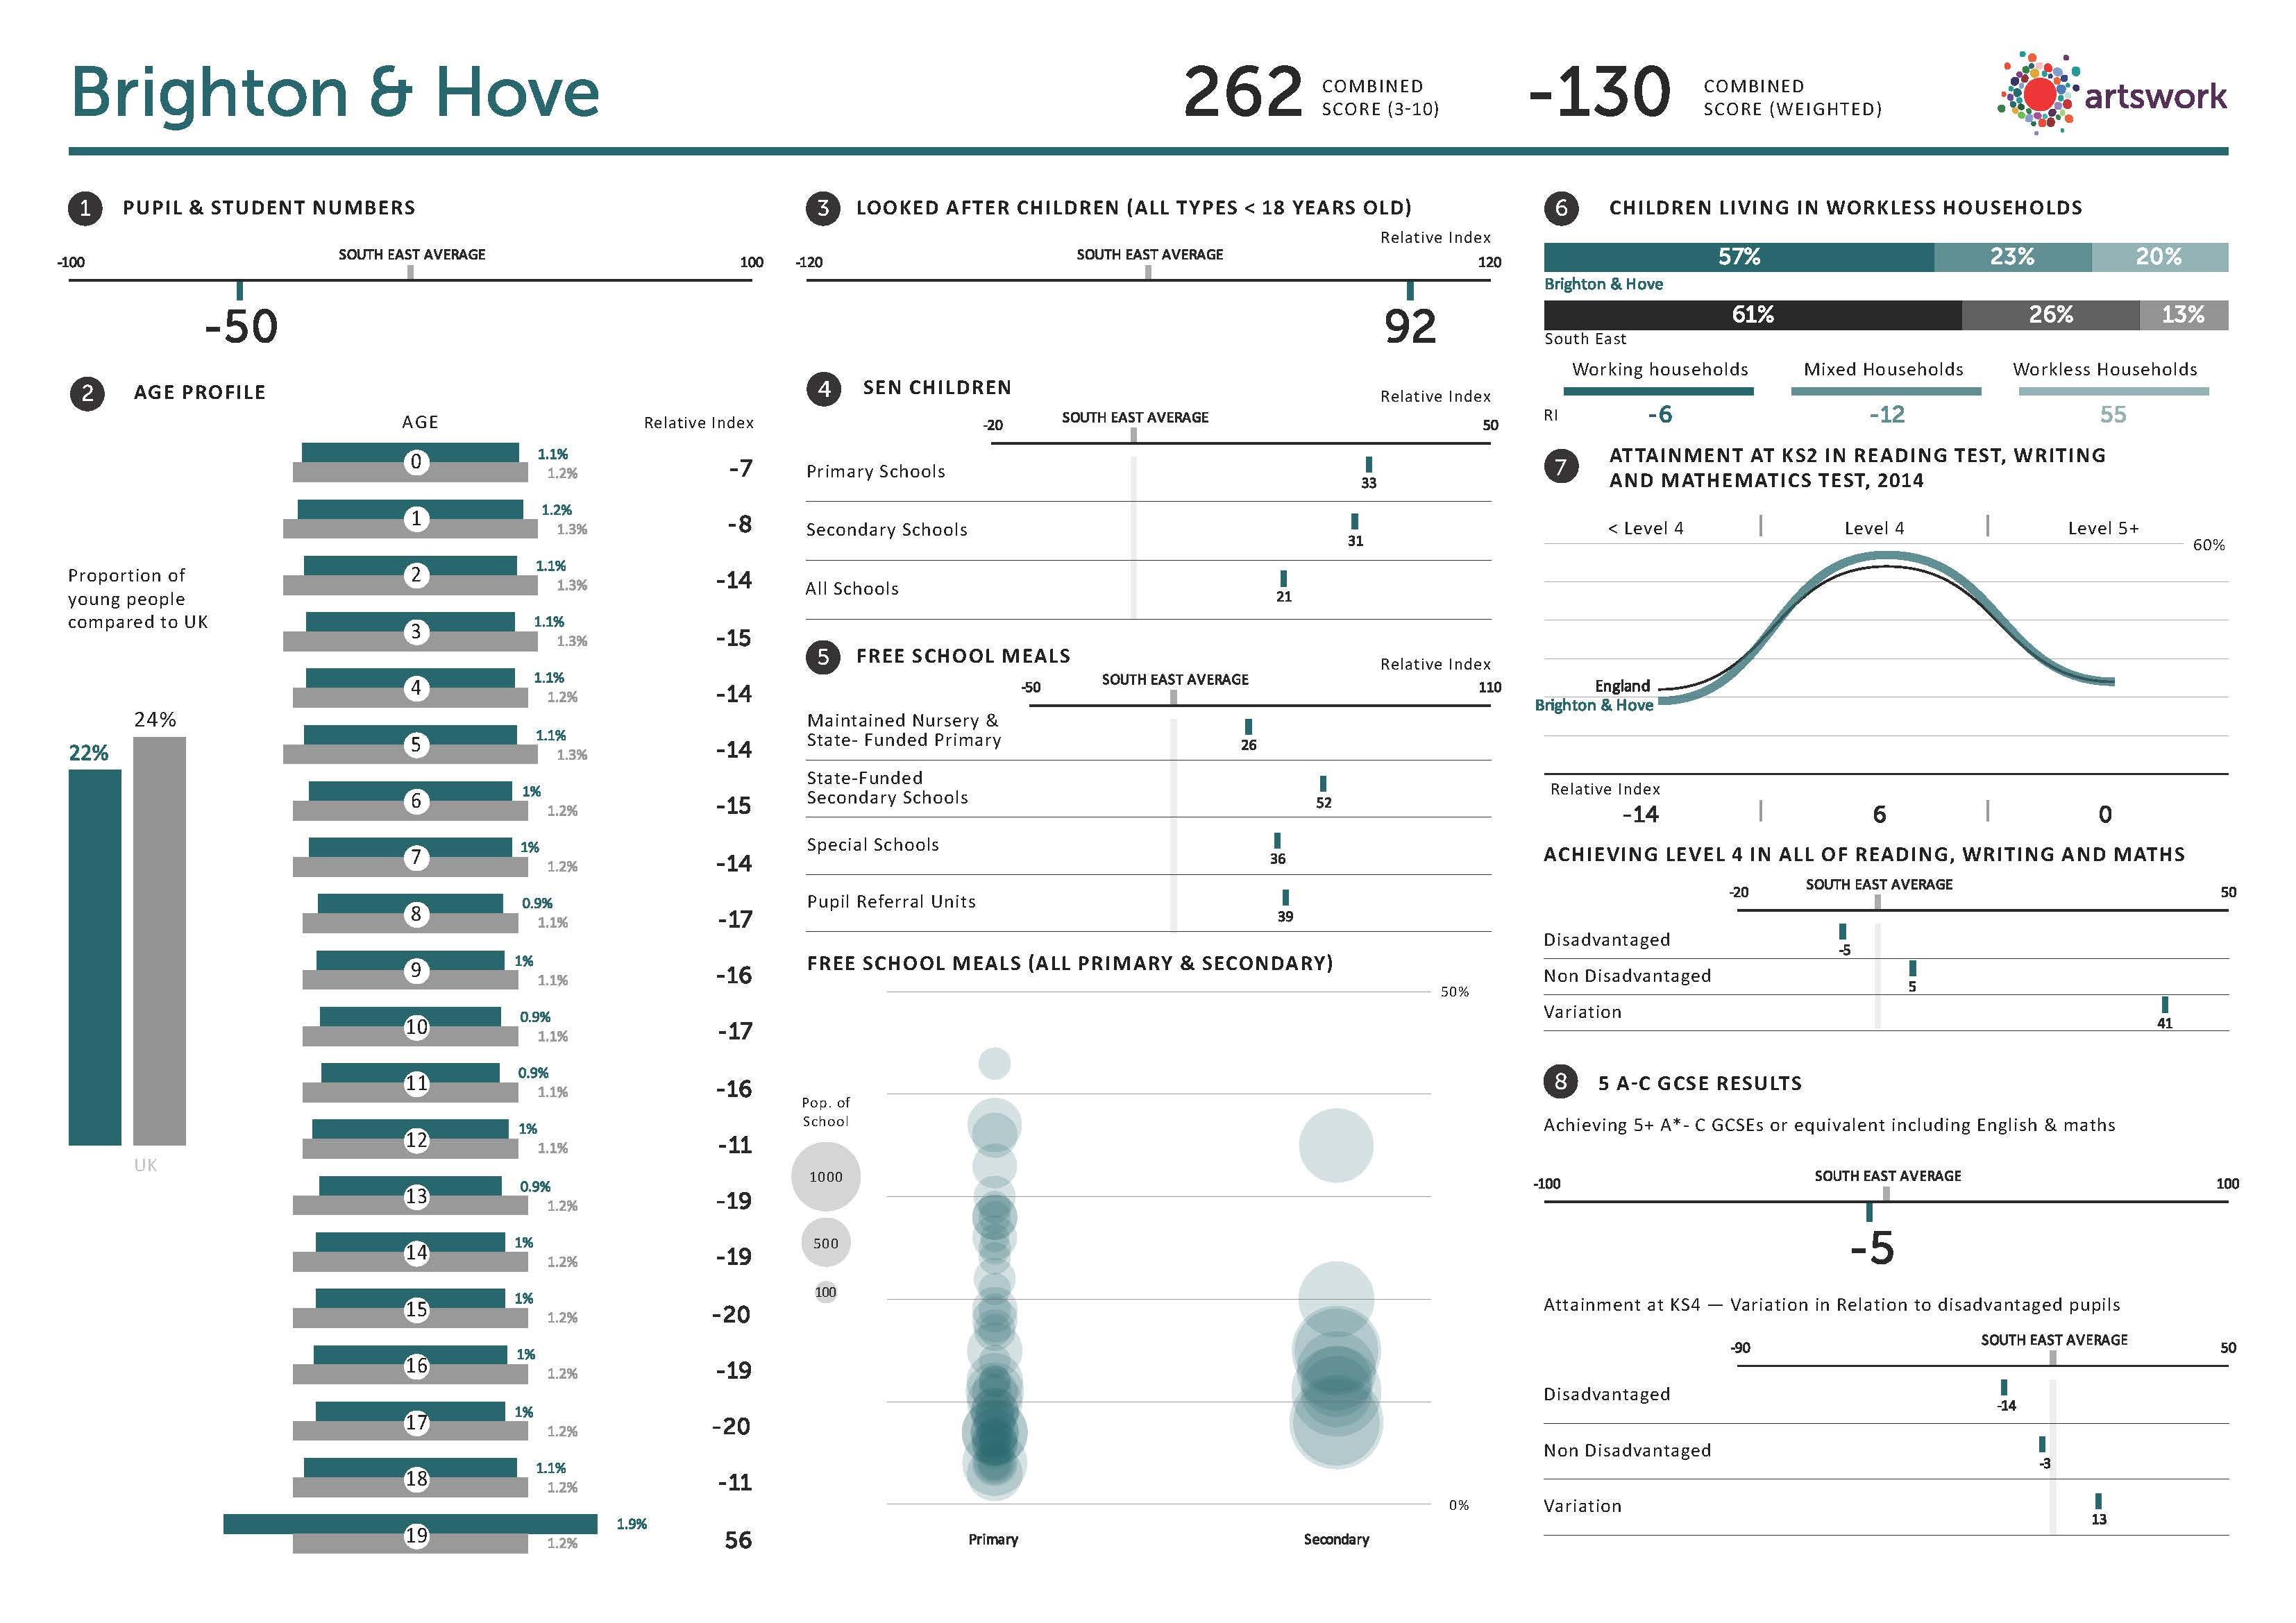
A few years back I was hired by a client to make a big PDF report on many countries around the world. This involved making a template then populating it with the data from each country. Again and again. This took a long time, and it was repetitive and boring and it made me wish for an easier way. But, as I’m sure we are about to find out, doing things the easy way is really difficult.
Change is hard
I tried to make sure that the template was signed off before I did All The Pages, but still change is inevitable and this is double true for client work. I tried to mitigate this using all the tricks and things I know about Illustrator (symbols for any repeated element etc) – but still – it was Stupid Hard and Stupid Boring.
Changes therefore had to be rolled out on hundreds of pages. This did not make me happy. It made me the opposite of happy.
Maximum Problems
Imagine a bar graph is set to a certain size, and later there is a value introduced that pushes the graph outside of those set maximums. But yes, Jack, surely you can just make that one smaller? I can… but I’m someone that cares very deeply about comparability across pages. I like consistency. I believe that you should be able to compare things visually and simply, and having scales that change to make the designers life easy is a violation of trust.
It turns out that comparability – a thing that many people would either not notice or not care about at all – is a hill that I’m willing to die on, and I’m OK with that.
Initial Development
First draft
I wrote the first draft of the program in Processing/Java. I didn’t have the abilities to do this in time for the very first client, but it was ready the next time a client came along with a similar problem. I managed to get it to the “good enough” state. This meant that it could take data, and with some work, turn it into graphs. It uses a grid based system to organise things. This means that graphs can be resized and moved easily.
Using it with multiple data sets was horrifically awful, and involved fiddling around with folders and naming conventions, things which I do not want to do. Even so, it was a success, because I could have comparability across pages due to global maxima and changes were easy .
Patterns of Use
I used it a few more times but it lacked any proper user interface. There was a good base that made all of the common tasks very easy, but actually using the program for client work was pretty slow to kick off. It had value to me, but it wasn’t something I could share with others.
It delivers perfect results at speed once it’s set up, but designing in the program is slow, and involves a lot of trial and error.
Goals
High Level Software Goals
Be able to share this tool with others
Make a tool that others can build inside, and on top of
Make it easy for designers to put static graphs on pdfs
Create a workflow that is not horrible to use
Open Source!
Learning
Improve knowledge of the basic web stack: HTML/CSS/JS
Improve knowledge of manipulating vector graphics programmatically: SVG vernacular, PDF reading, writing etc.
Improve knowledge of frameworks such as d3, React, Node.js etc
Current State
I have a web based application running locally. Most of it is D3 + SVG.

On the left is the nodeSpace. The right workSpace is where the PDF pages will sit. This is the composite view. Pressing 1 opens just the nodeSpace view, 2 is composite, and 3 is workSpace. On mobile the two parts sit on top of one another.
I have the beginnings of a OOP based system (remember, I made this first in Java).
I can drag these black and white Draggable boxes around the two spaces, and that green spot is the beginning of a Port for a Portable class. I’m building up to a Node.
These spaces are big empty SVGs, and the boxes are groups within them.
It doesn’t have colour because if the design doesn’t work without colour then the design doesn’t work
Problems
Just getting the graphs on the page again
If you can help with any of these, please get involved. Writing these all down made me realise just how many of them there are…
Problem 1: Assumptions
For stress testing and marked for death
Assumption 1: Nodes
This is a problem that is best solved with a node based paradigm
It’s Scratch, but for Data-Viz
I wanted to make something that combined data visualisation with this:
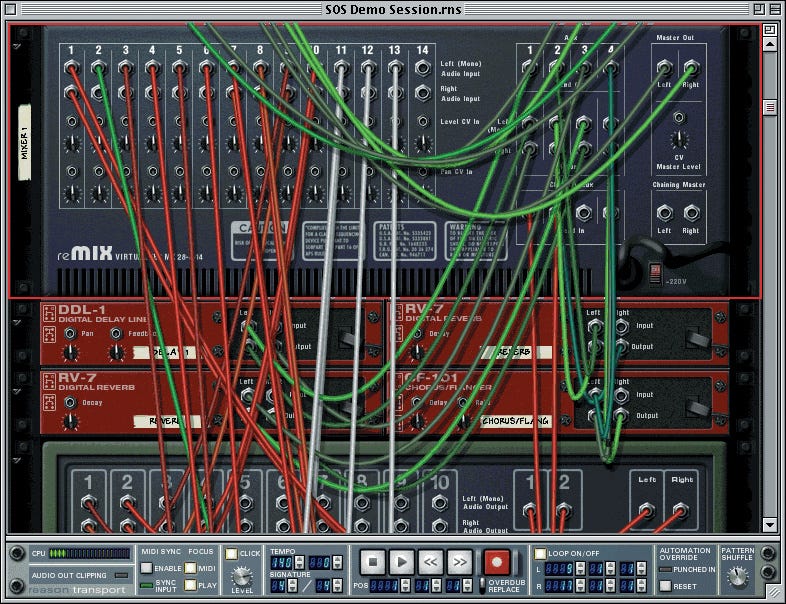
I imagine dragging and dropping CSV files into a workspace, hitting TAB to show the cables and connecting the columns up to the charts.
This will manifest as something that will look and behave like Blender nodes:
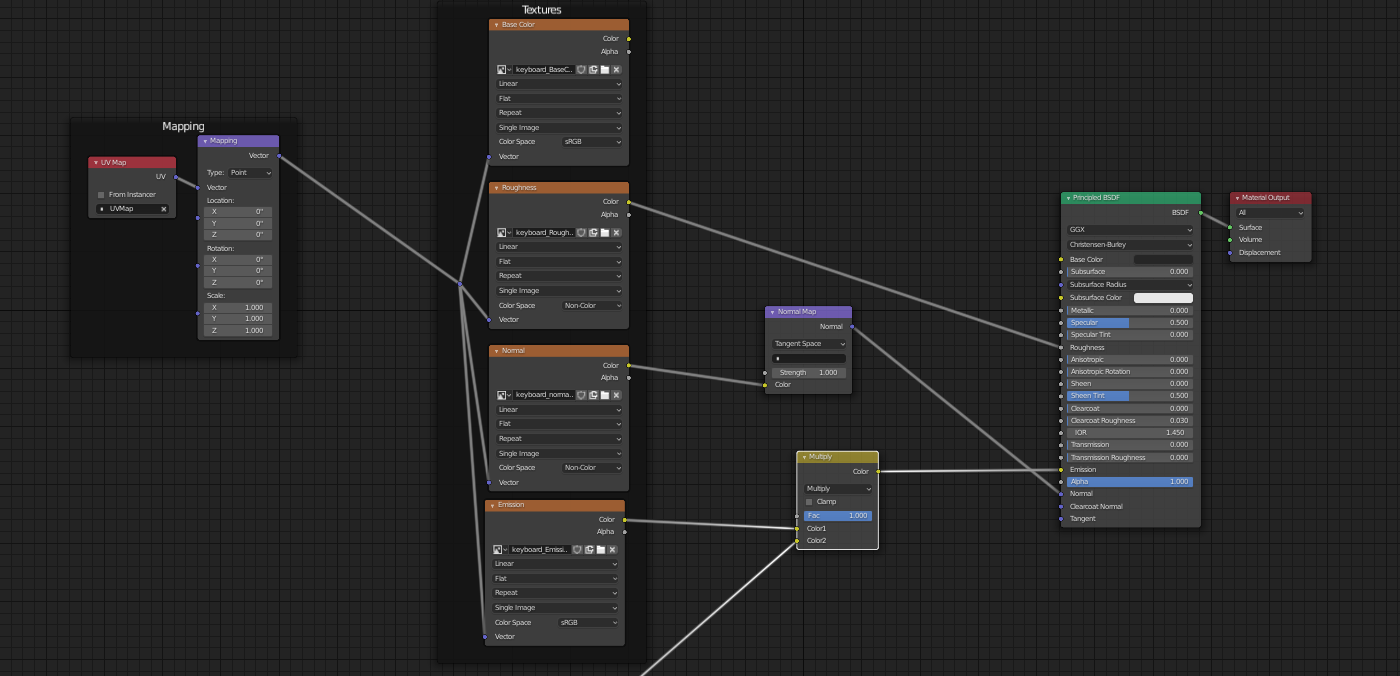
Problems with nodes come in when thinking about arrays and loops, something that node based workflow is not traditionally good at. It’s not insurmountable, but it needs to be done in way that is natural. Since dealing with arrays of pages and data is the main crux of the problem, it bears careful thought!
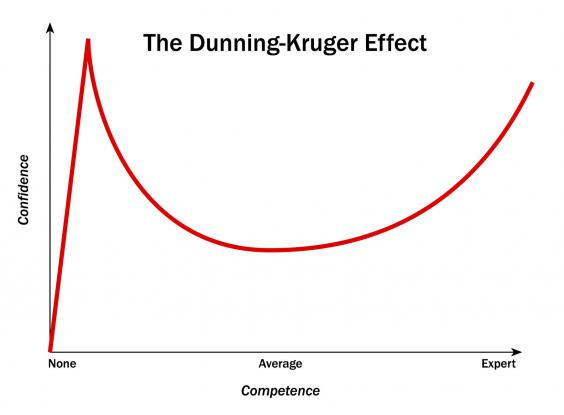
Assumption 2: Speed
“I’ll have a prototype in a week or two”
– me, some time ago, (from the other side of the Dunning Kruger graph)
Problem 2: Lack of knowledge
I don’t really know what I’m doing. Luckily this is something that can be fixed by:
Doing more things that I find hard
Thinking about the problems
Writing about the problems
I feel as if I’m in the difficult middle phase: I know just enough to know how bad I am at it.
GitHub
I have set up the GitHub, but at the moment I don’t take advantage of many of the features. I basically use it as a backup server. I’ve many versions of the software so far, but extremely bad version control. Something that I have a vague idea that git was specifically designed to solve…
D3
Early on in the process I decided that D3js + SVG was the stack for me.
It was D3 or Canvas, really. I have used canvas before for complex data stuff, which ran very slowly.
React
I’m torn on React. It has a bunch of stuff that makes things really easy, but it’s not something that you can just have a little bit of. It’s do or die. React is a jealous god.
For example it’s easy to imagine this app working with these two React libraries, with D3/SVG making geo to sit on the page:
Rete
This is a Visual Programming library
PDFme
This is a PDF generation library.
Problem 3: Design
I’m building something that there is no explicit design for
This worries me the least - perhaps this means it’s assumption 3. I feel as though I can just carry along and trust my own gut with this. The beauty of a one-person team is that there is no-one that I need to brief in.
I don’t want to go down the Design rabbit hole just yet. The thing is that I find making designs that look beautiful to be a non-difficult problem. It’s a problem that isn’t necessarily easy, but one that I have well shaped tools and processes to solve.
I have thought about the design of the interface in only the most general terms. Understanding that there are boxes that need to be moved around, and lines to be drawn, I have been concentrating more on the technology side of making these boxes and lines happen.
I’m more worried about having something beautiful that doesn’t work, and having problems with the interface that I simply could not have imagined before I started making things.
I’m also conscious that perhaps the people I am targeting for this program won’t always be designers, and also that design for designers is self indulgent and mainly not very good.
If anything I want it to be consciously under designed, utilitarian. This is something that can be achieved by not adding things that aren’t needed, rather than editing them out later.
Thank you
Honestly if you have made it this far, I salute you.
React
You should commit to learning the React framework. The ecosystem is massive and you'll find lots of support for whatever it is you end doing because of that. Think of it as including ready-made (Lego) bricks to your build. Don't reinvent the wheel. Learning the most widely used framework in the world well will pay dividends you can't conceive of right now.
Git
Being able to return to a previous state is invaluable. The directory you're working from should include a git folder. Then whenever you develop a new feature you branch out first, away from the main tree. Git is basically a tree consisting of nodes that you can return to whenever you please. Each node is a "commit". You're committing to its history and growth. Whenever you change something you should make a new commit and add a description of what it is you're trying to accomplish. I use active phrases for my commits for a variety of reasons that I may return to later. Git allows you to select a branch and say to a service like Netlify "hey this is the production branch, only deploy automatically from this branch". Now you can safely test, and experiment with, your other branches without affecting the product your customers are using. I won't dive into how Git works here but I will urge you to prioritise it as a learning goal.
Data Structures
You will probably want to look at the graph data structure instead of arrays. I couldn't tell if you aren't already familiar. I don't know if Markdown works in the comment section but [this might help](https://blog.javascripttoday.com/blog/graph-data-structure-in-javascript/). I don't have any experience to offer but my gut tells me you're on the right track. Maybe [this](https://nodes.io/story/) blog post will help you feel more at ease with making the assumption that a node based paradigm is the best way to go about it.
Other
Incomplete sentence? "There was a good base that made all of the common tasks very easy, but actually using the program for client work was pretty slow to kick off. It had value to me, but it"
Incorrect word order? "How can easily I make multiple pages of static graphs?" Sounds wrong to my ear, and almost made me stop reading, but I'm overly sensitive. You may not care or maybe it's correct and I'm just a whiny asshole.
Pitch
Your pitch is excellent for its intended audience. "Scratch for data viz" . It's short and easy to remember. Easy to google for.
Final words
That initial draft made me pause. I'm impressed. I think your aim is to develop a proper user interface to make the design of such visualisations easier to accomplish. If that's incorrect, please correct me.
Best of luck and never give up.
You better salute me I read to the end but with not much understanding of your problem. I learned something however, the Dunning Kruger Effect which made me smile.